
We understand that being able to review your pipeline at a glance and see key stats at an agent or office level is really important to our users. We plan to deliver even more in depth reporting in the long term, what you see here is just the beginning. If you have any suggestions for other reporting that would be useful to you or your office reach out to us at product_updates@realtair.com.au
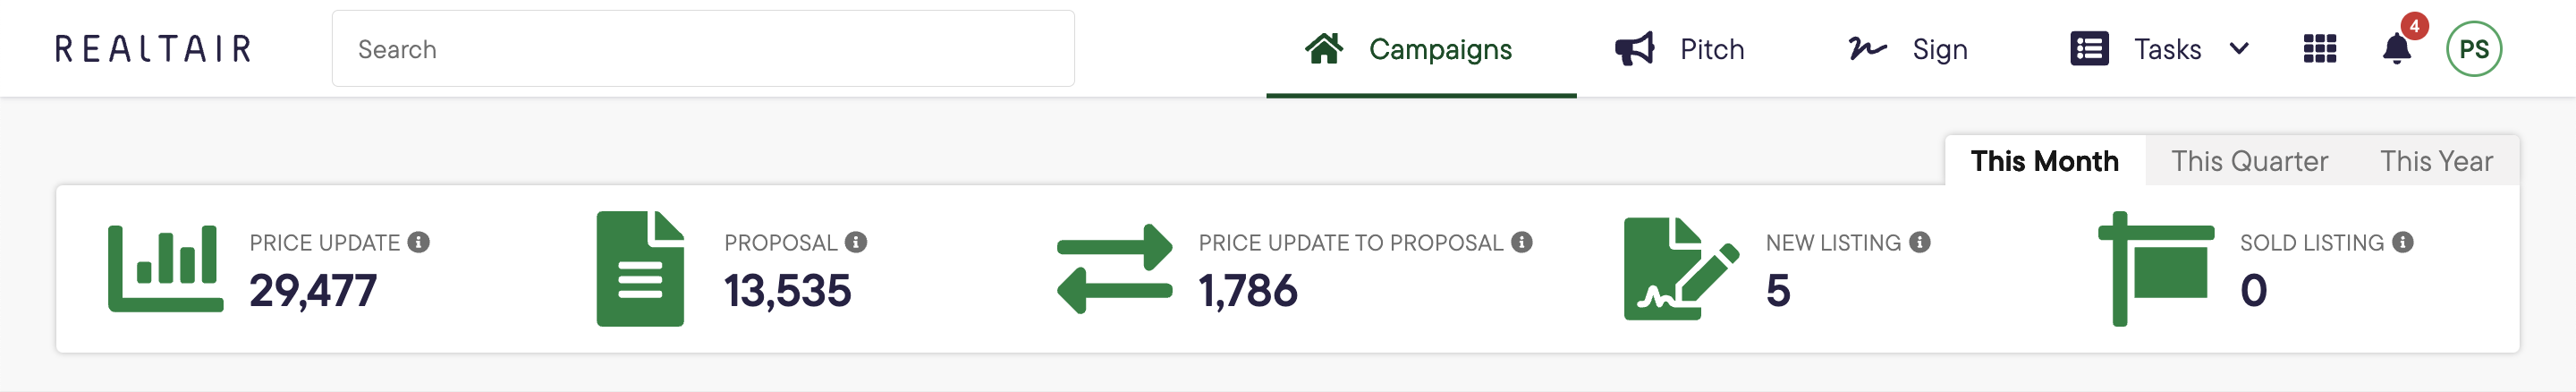
If you are an agent when you land on the dashboard you will see a view similar to the one below.
If you are an office admin you'll see a view similar to agents but as a bonus you will also be able to filter the view to see numbers for the offices/agents you work with.
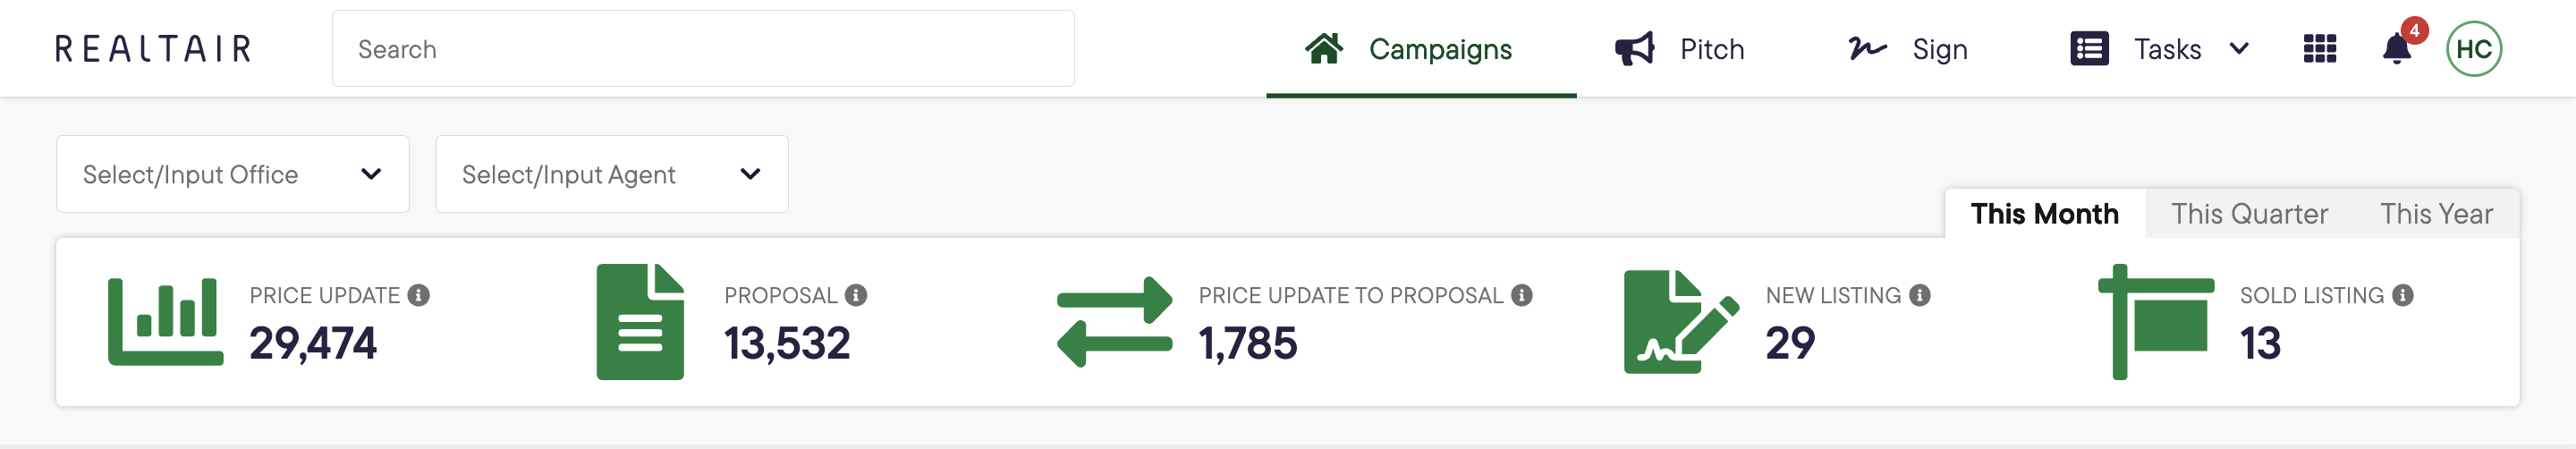
Here's a handy guide to what each of those numbers represent:
- Price update: number of templates generated with type of price update in the defined time period
- Proposal: number of templates generated with type of proposal in the defined time period
- Price Updates Converted: Number of campaigns that have generated price update and proposal presentations in the defined time period
- New Listings: Total number of campaigns that have been set to “listing” or “live listing” in the defined time period
- Sold Listings: total number of campaigns that have been set to “under offer”, “exchanged” and “settled” in the defined time period
And also a rundown on each of the time frames you can filter by:
- Month - current month to date ie all numbers from 1st October
- Quarter - current quarter to date, quarters cover
- Jan - March inclusive
- April - June inclusive
- July - Sept inclusive
- Oct - Dec inclusive
- Year - current year to date